
 Order Management
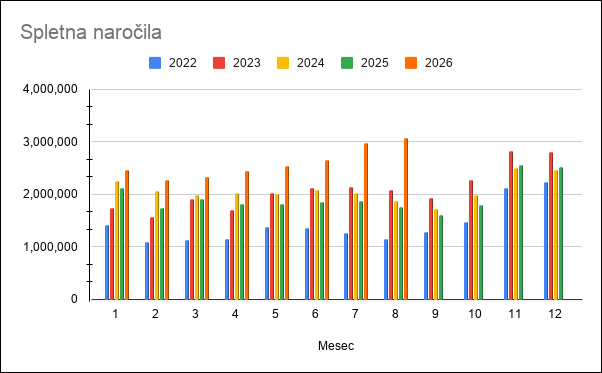
August is the first month above three million orders
Every month we publish a few figures on how Order Management is actually being used. This is August 2026.
TL;DR (In short)
- In August 2026, 3,066,319 orders were processed, which makes it the first month above three million and the highest so far.
- The previous record was held by July 2026, so the last two records were both set in the summer months.
- The peak of the season is still ahead of us, because in online retail the strongest month is November.
What is on these charts
Below are the five metrics we track every month. In each one the years are drawn over each other, so what matters is not only what happened in August but also how August has moved from year to year. The data is the aggregate of all users together.
1. Orders received per month
Online orders that came into Order Management, by month, from 2022 to 2026. The August bar is the tallest in the whole chart, and with 3,066,319 orders it is the first month above three million.
2. SMS notifications sent
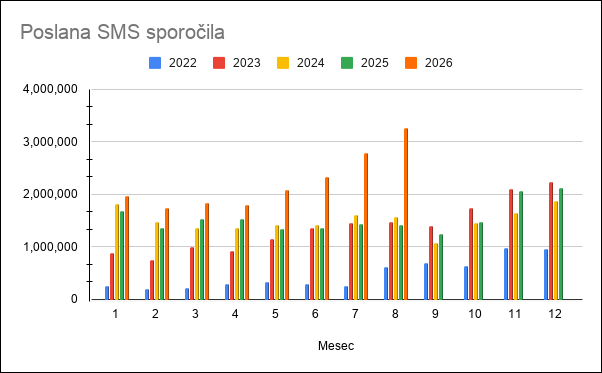
Messages sent to customers about the dispatch status of their order and when invoices are sent. Compared from 2022 to 2026.
3. Email notifications sent
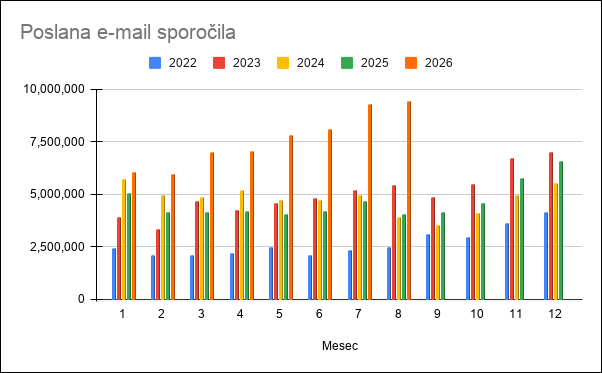
Emails to customers about the dispatch status of their order and for sending invoices. Compared from 2022 to 2026.
4. Abandoned carts processed
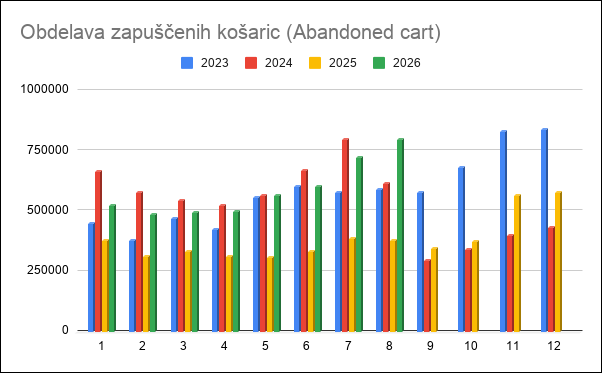
Abandoned carts picked up by the system, and the prompts inviting the shopper to finish the purchase, sent by email or SMS. Compared from 2023 to 2026.
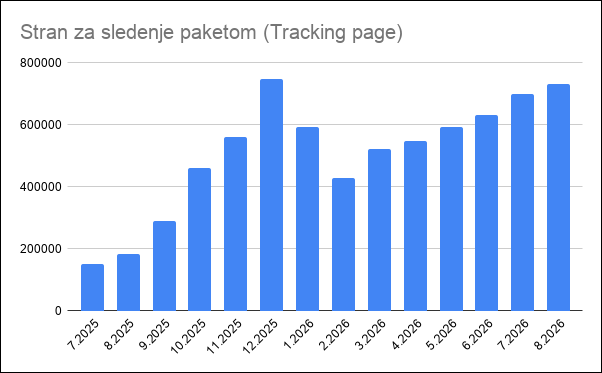
5. Shipment tracking page visits
How many times customers opened the tracking page to check where their parcel is. This is also the most direct measure of how many delivery questions the page takes over instead of your support team.
What this means for the autumn
The August record is not the peak of the season but the starting point for it. From 2022 to 2025, November brought on average 54% more orders than September, which is why it is worth reviewing your processes now. How that looks year by year, and where the operation breaks first, we wrote up in the article Christmas comes in November for online merchants.
Congratulations to everyone on the growth, and we hope it continues through the rest of the year.
These figures are our users’ orders
If you run an online store and still assemble order processing out of several tools, give MetaKocka a try.
| Try it out |
Wishing you business success,
MetaKocka Team
Would you like to be informed about news and optimizations?