

Order Management usage statistics: June 2026
A look at what our users actually put through Order Management last month, and how the same month compares with the years before it.
Every month we publish a few figures on how MetaKocka Order Management is being used. Each chart plots one metric month by month, with the years laid over each other, so you can see not only what happened in June but how June has grown over time.
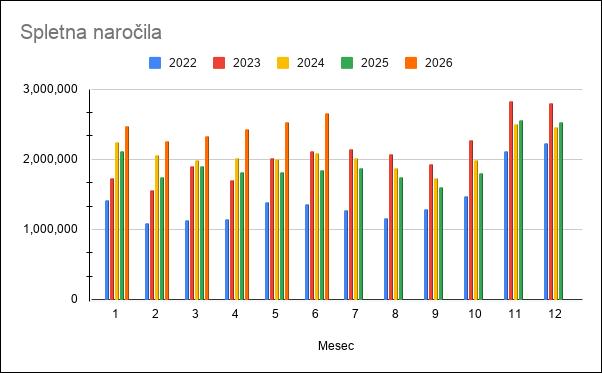
1. Orders received per month
The number of online orders that came into Order Management, by month, from 2022 to 2026.
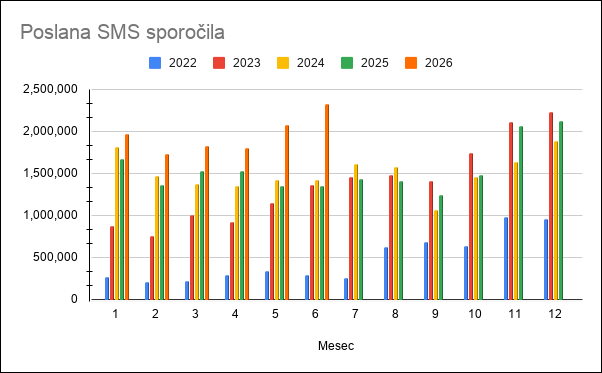
2. SMS notifications sent
Text messages sent to customers about the dispatch status of their order, and for invoice delivery. Compared from 2022 to 2026.
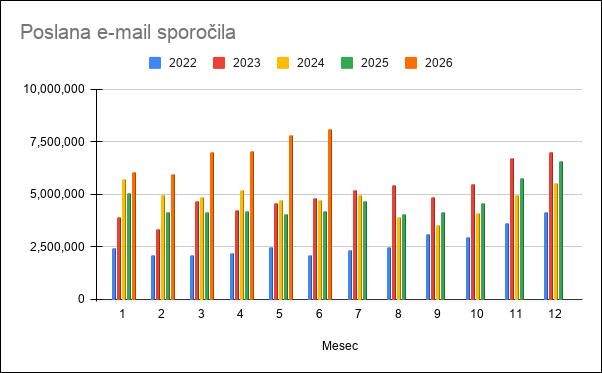
3. Email notifications sent
Emails sent to customers about the dispatch status of their order, and for sending invoices. Compared from 2022 to 2026.
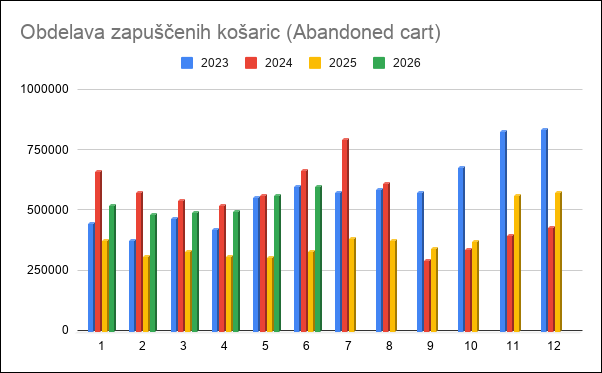
4. Abandoned carts processed
Abandoned carts picked up by the system, where the shopper was invited by email or SMS to finish the purchase. Compared from 2023 to 2026.
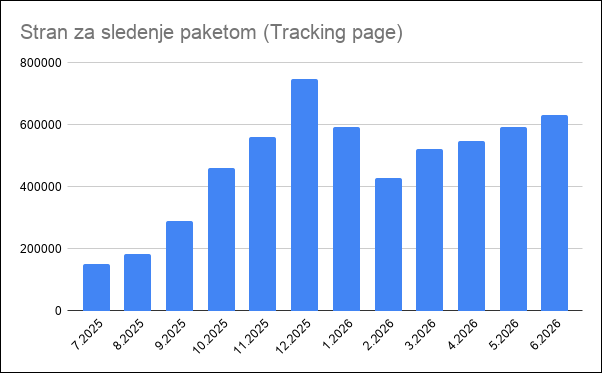
5. Shipment tracking page visits
How many times customers opened the tracking page to check where their shipment was. This one is shown as a rolling twelve months, from July 2025 to June 2026, rather than as a year on year comparison.
Congratulations
Every one of these numbers is your work, not ours. Congratulations on the growth, and here is to carrying it through the rest of 2026.
Wishing you business success,
MetaKocka Team
Would you like to be informed about news and optimizations?